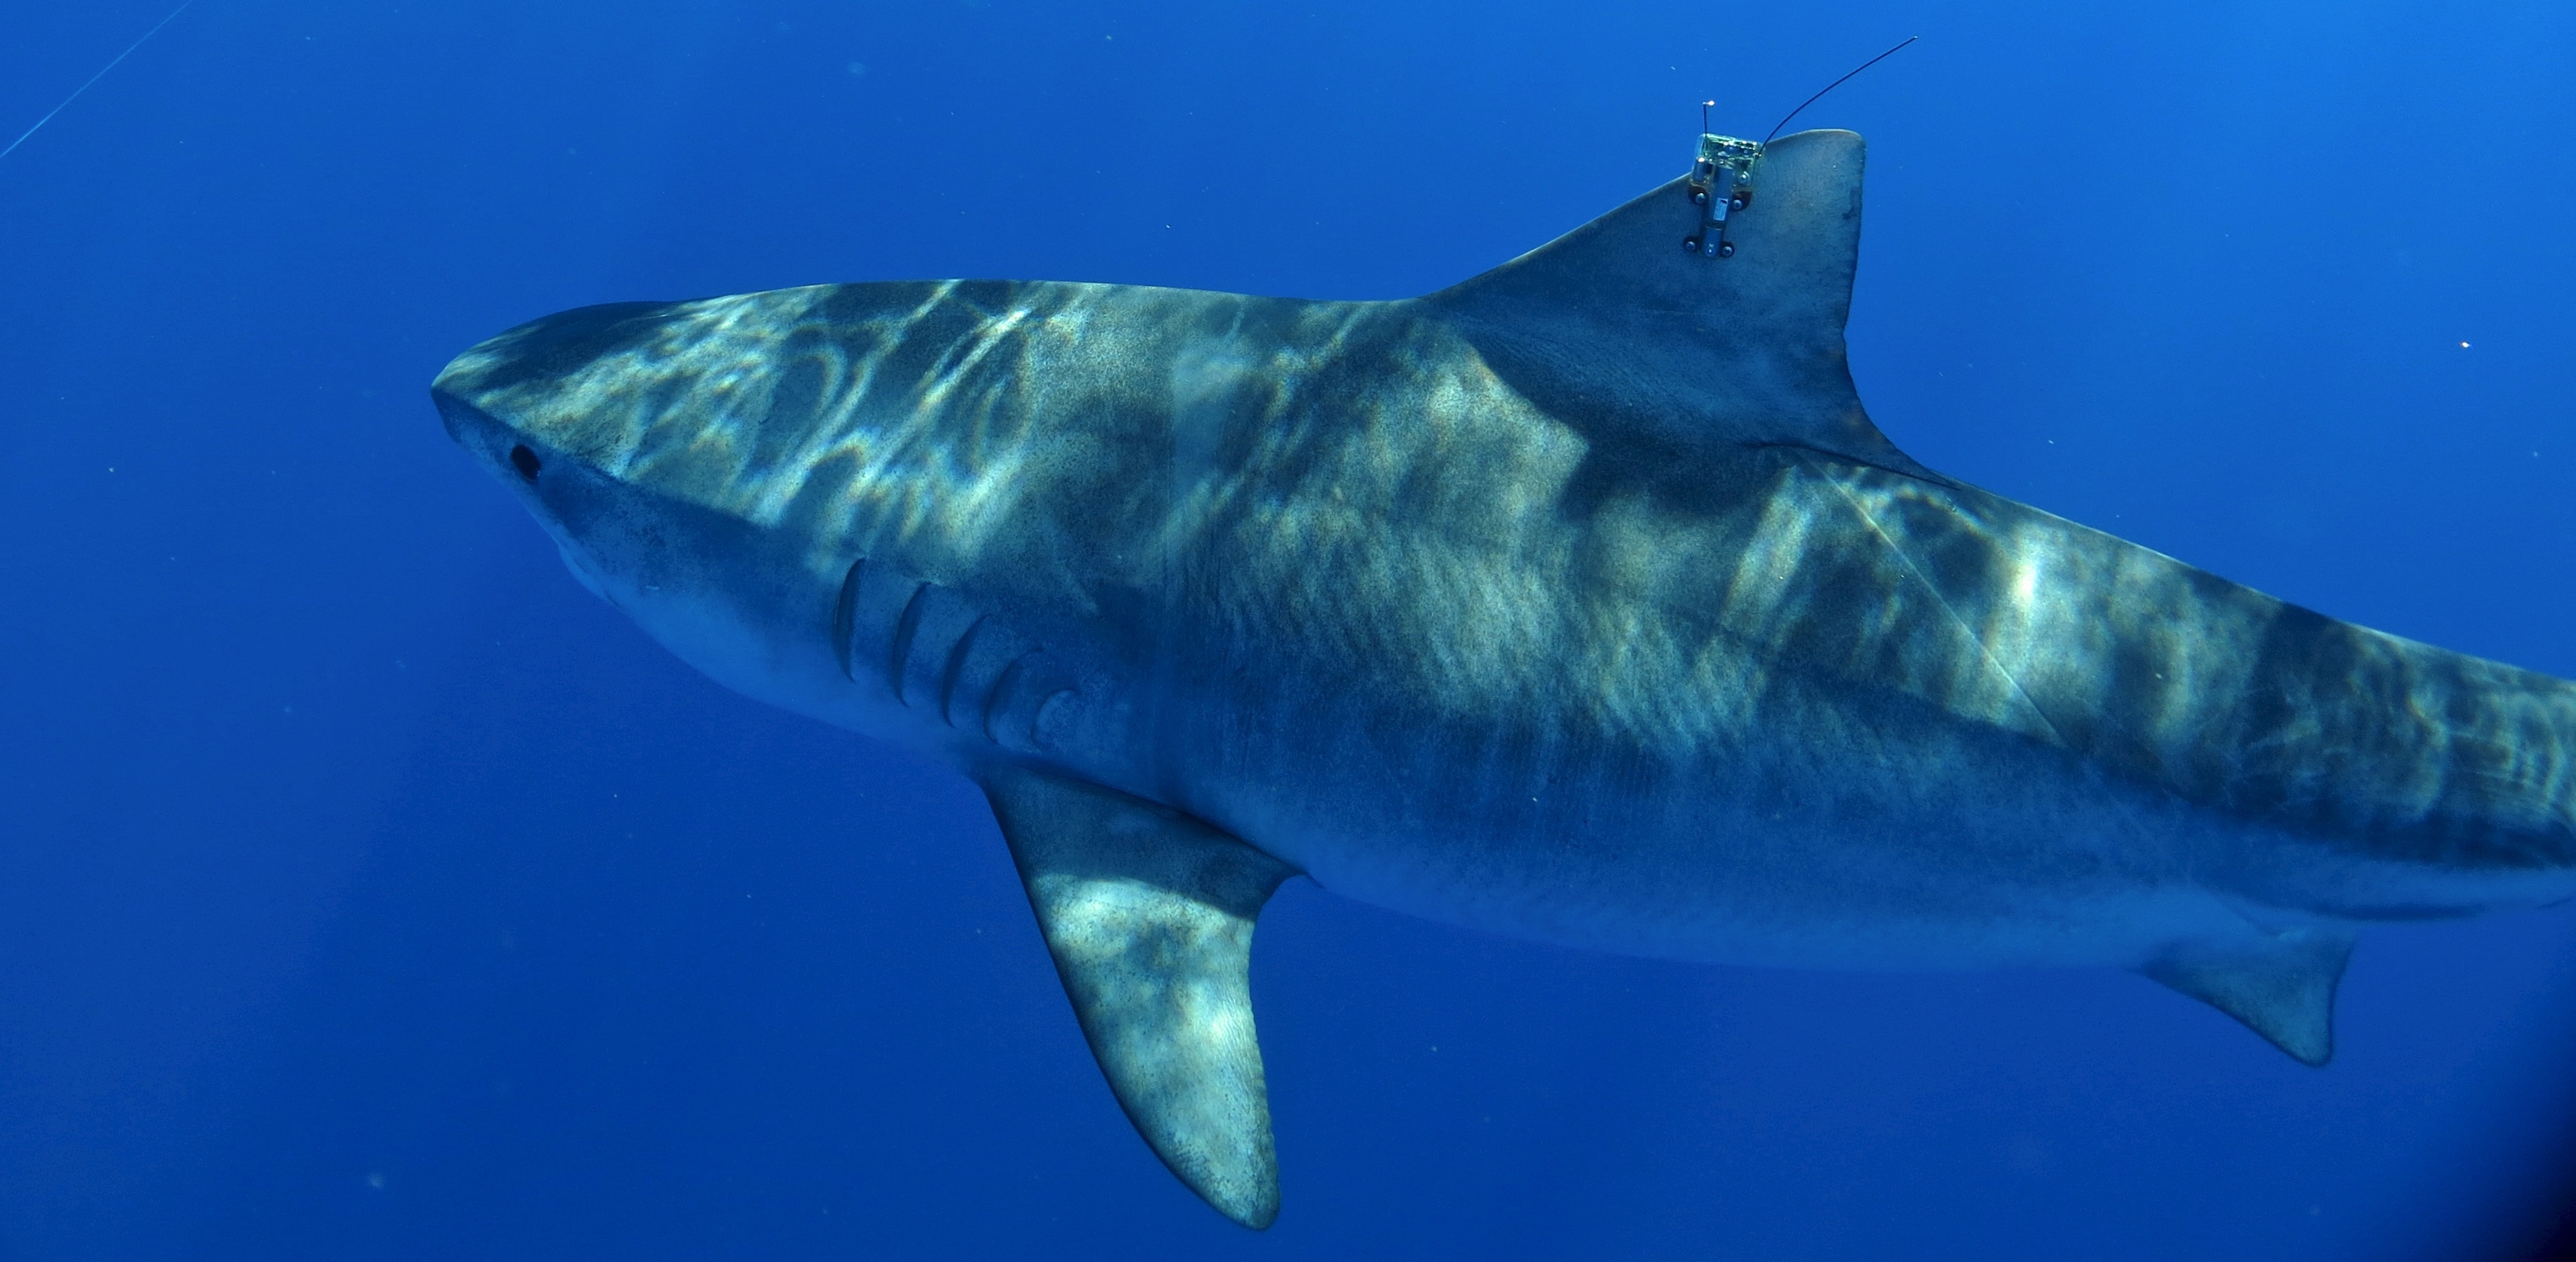
In this brief descriptive analysis, I use data from the Pacific Islands Ocean Observing System (PacIOOS) to characterize tagged Tiger Sharks that roam the Pacific Hawaiian waters, specifically around the islands of Maui and Oahu. The dataset contains 46 different tagged sharks, spanning 7036 observations which represent the number of times the 46 tags registered with 27 acoustic receivers around placed around the islands. This dataset was aggregated from multiple survey periods.
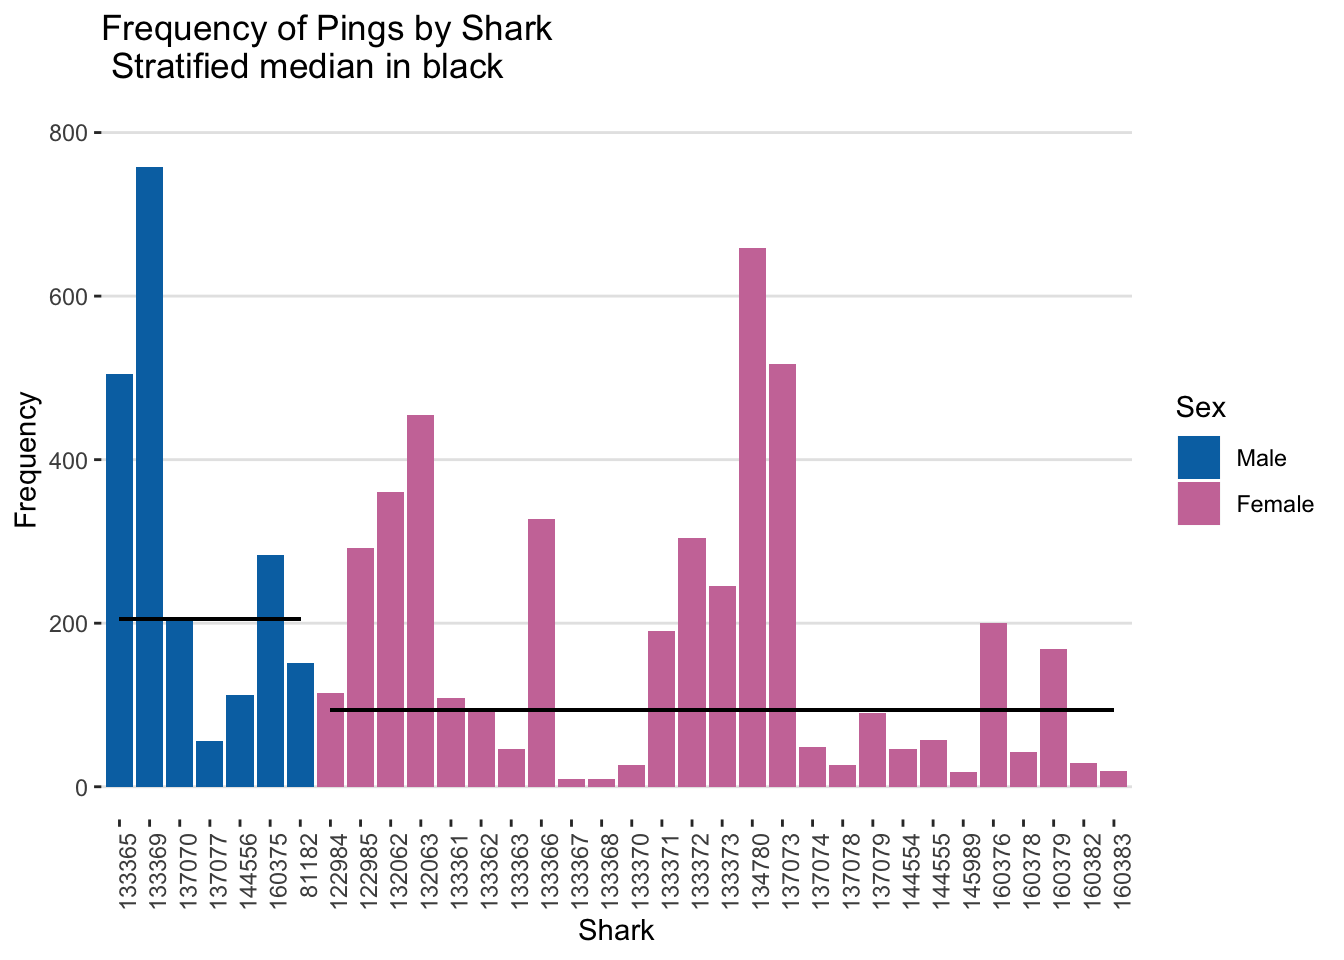
To get a sense of how often the tagged sharks are swimming close enough to the receivers to register ‘pings’, we plot the frequency of observations by shark. Observations range from 5 to 758 (standard deviation = 182), with a median of 57. The wide spread in frequency of observations could be due to a variety of factors including, but not limited to: differing times under observation, a tendency to feed regularly near a receiver site, and the distribution of receiver sites.
FALSE    Min. 1st Qu.  Median    Mean 3rd Qu.    Max.
FALSE    5.00   28.25   56.50  152.96  203.75  758.00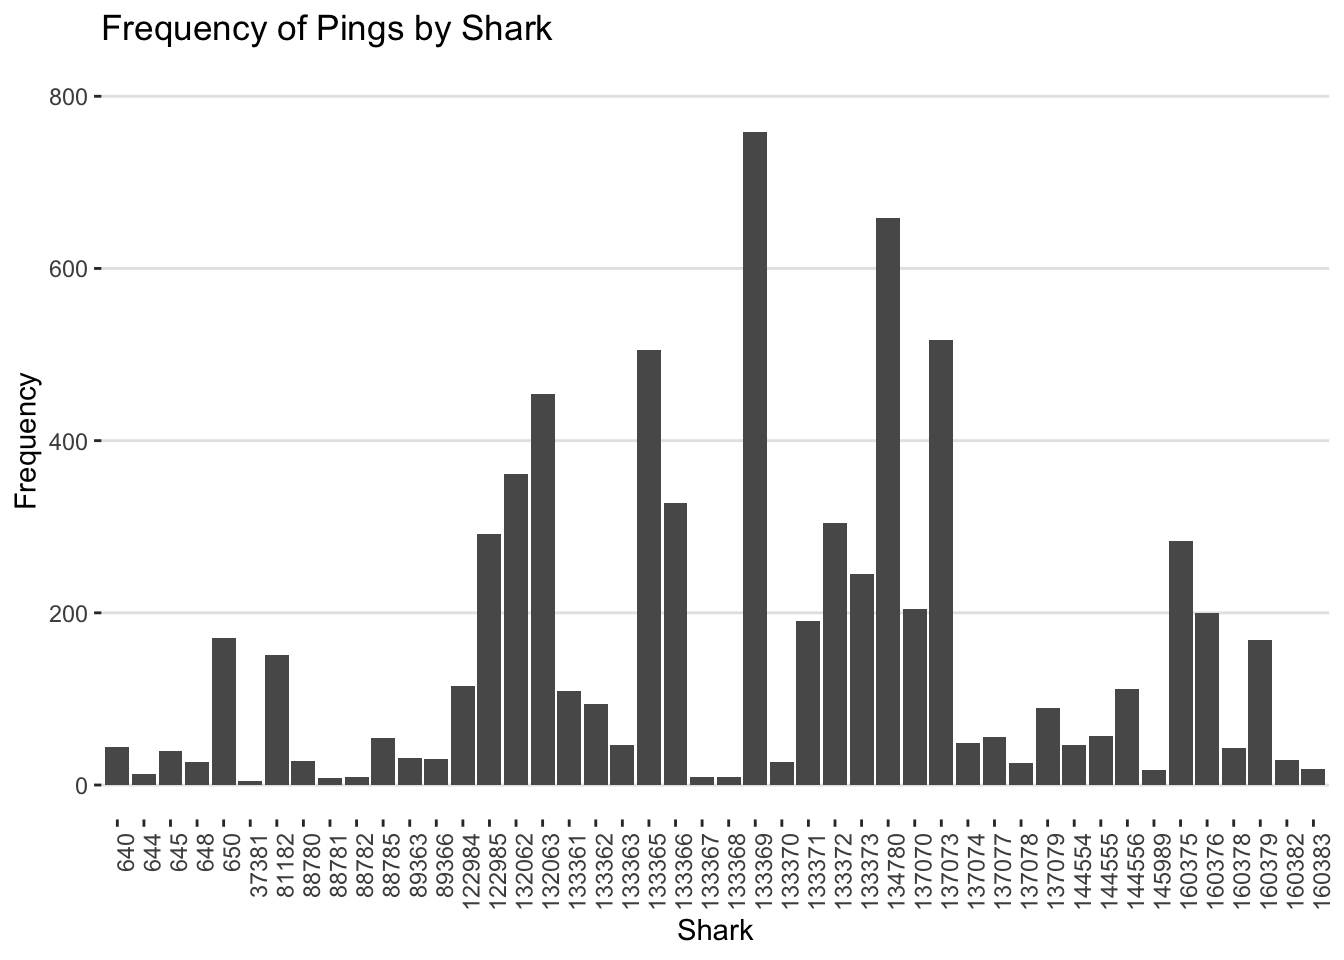
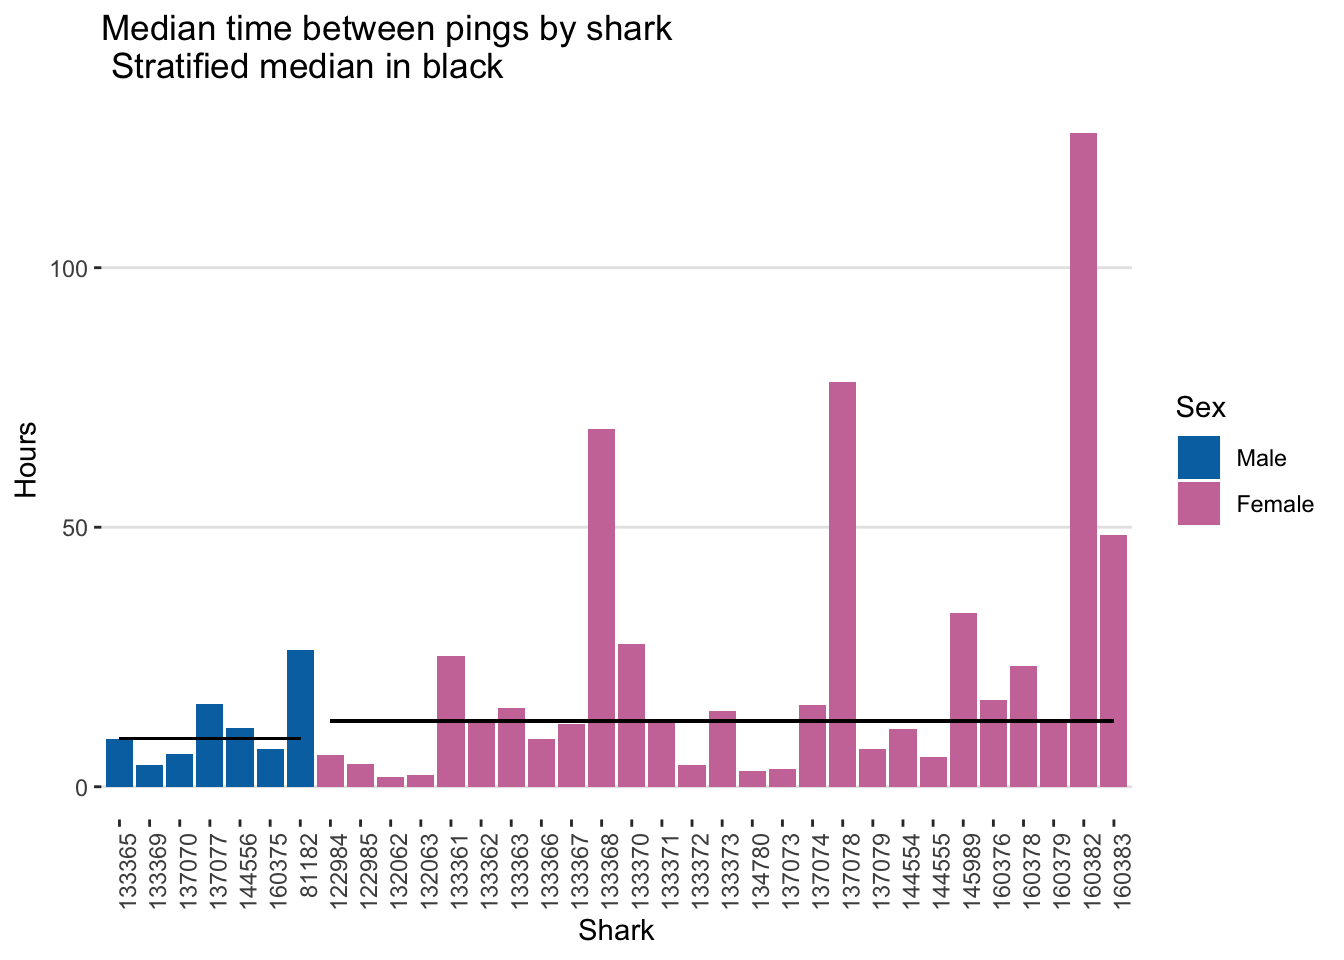
By examining the median time (in hours) between pings by shark, we can get a sense of whether certain organisms tended to spend more time around receivers than others. Median time between pings (rather than mean) was selected due to the highly skewed distribution. Additionally, we can calculate the Spearman correlation between frequency of pings and median time between pings to further understand this relationship. Spearman’s correlation is a rank-based correlation that is used when the data vectors are not normally distributed.
Testing the hypothesis:
-
-
we can answer whether there is a significant trend between the two variables using the cor.test function with option method='spearm'. and the test returns a p-value < 0.05 indicating a significant negative trend: as the frequency of pings increases, the median time between pings decreases. One plausible explanation is that organisms with a large frequency of pings are hanging around receivers for long stretches of time, decreasing the time between pings.
FALSE    Min. 1st Qu.  Median    Mean 3rd Qu.    Max.
FALSE    0.00    1.64    6.56   27.23   16.66 3159.25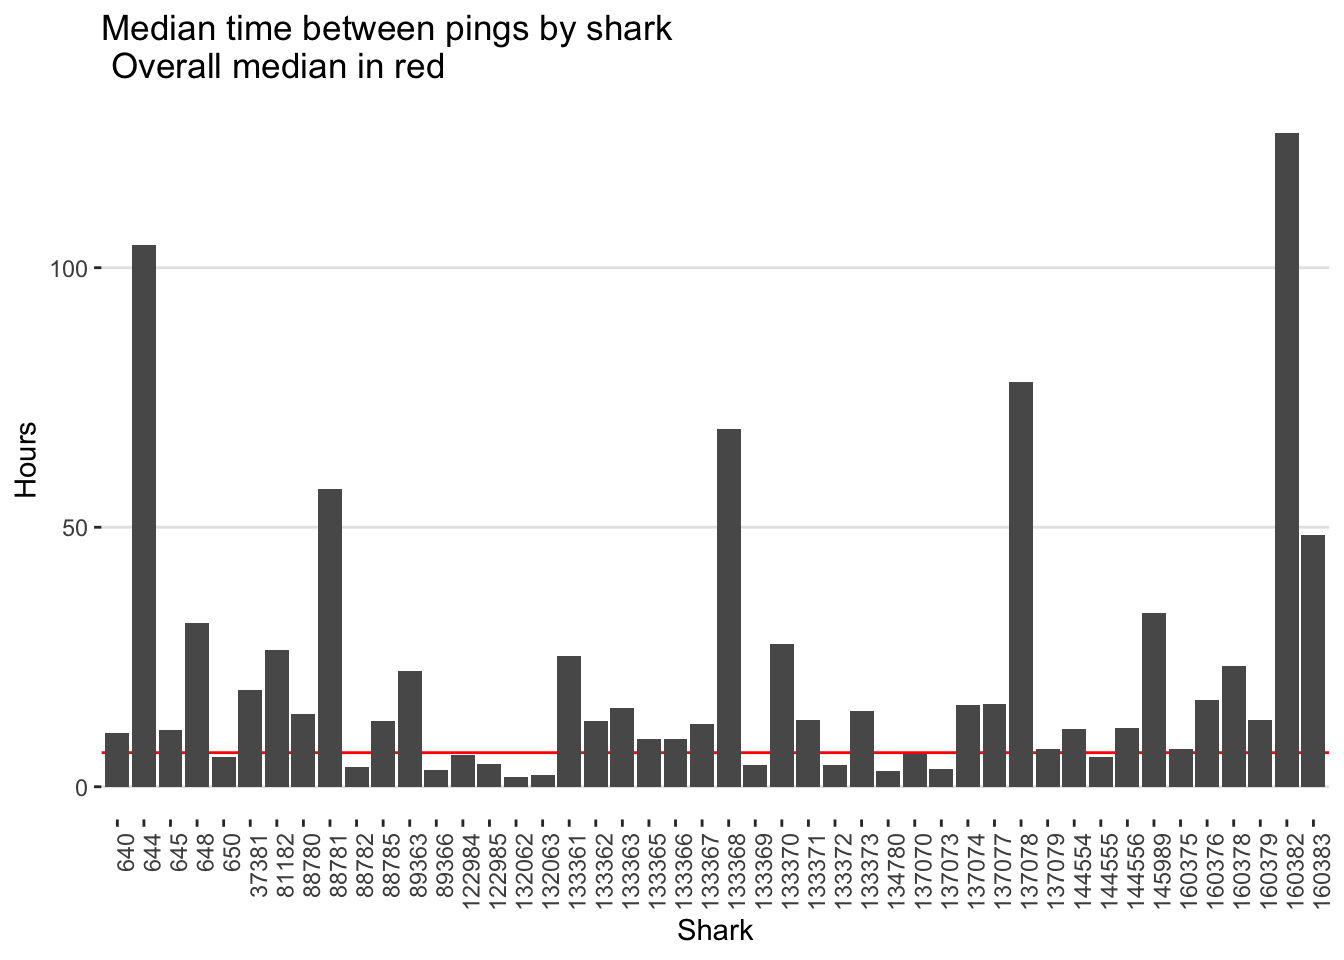
A subset of the data contains information on sex and length. After excluding those without the additional covariate information, we are left with 27 females and 7 males. It is well known that female sharks grow longer than males to accomodate for pups. This holds true, with females measuring 12.4 ft (3.8 m) on average, compared to the average length of males: 11.3 ft (3.4 m).
##   sex length_ft Freq
## 1   0     11.29    7
## 2   1     12.37   27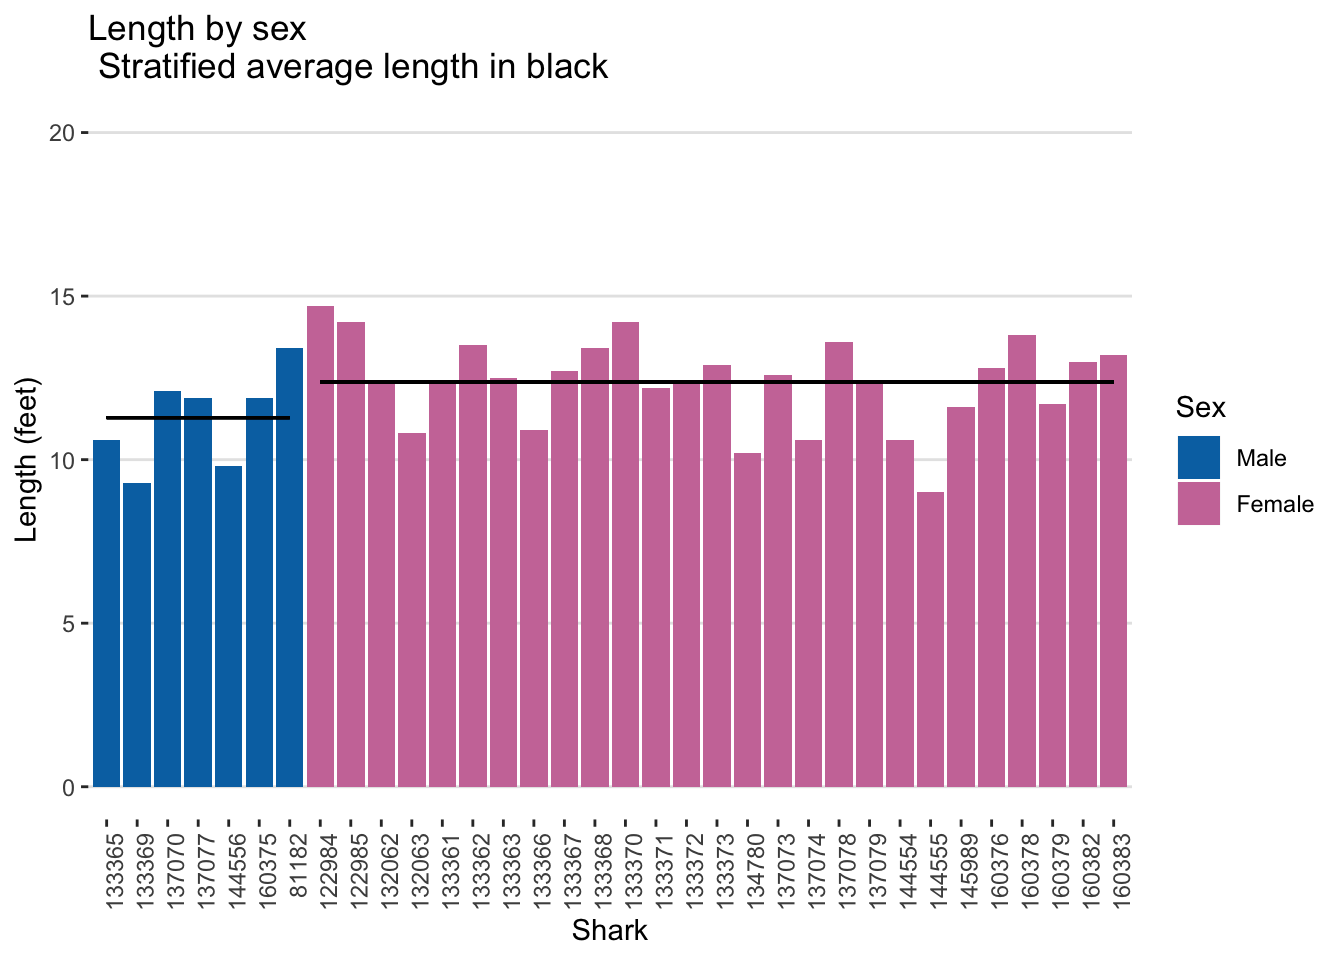
Using length and sex we can also classify the organisms as sexually mature or not. Males reach sexual maturity at 2.3-2.9 m, while females mature at 2.5-3.5 m. To categorize the organisms, I used the midpoint of these ranges. All of the tiger sharks, except one female are considered sexually mature by these cut points.
We can reexamine the above initial features of frequency of pings and time between pings stratifying by sex. Unfortunately, conducting inference to look for significant differences between the two groups is ill-advised due to the small sample sizes. The median number of pings differs substantially by sex: 205 for males vs 94 for females. Note that the male group may be influenced by having a small sample size, and may not be representative of what the median would be under a larger sample. Both of these are greater than the overall median from the original sample: 57 pings.
Finally, we reexamine the median time between pings (in hours) by sex. Prior to subsetting and stratification, the overall median time between pings was 6.6 hours. Afterwards, it is 9.3 hours for males and 12.7 for females.
The last, and most exciting part to look at is the actual ping locations which shows where the tiger sharks are travelling and how often they are spending time off the shores of the islands. To do this, I’ve built a Shiny app utilizing Leaflet (for the first time… so please excuse it’s lack of grand sophistication!) to show the where each shark was pinging while under study. Unfortunately it can’t be integrated into the webpage, but click here or on the image below to be redirected to the app. (And if anyone knows why my map marker of a shark head works on desktop browsers but not mobile browsers, please for the love of god, help me).
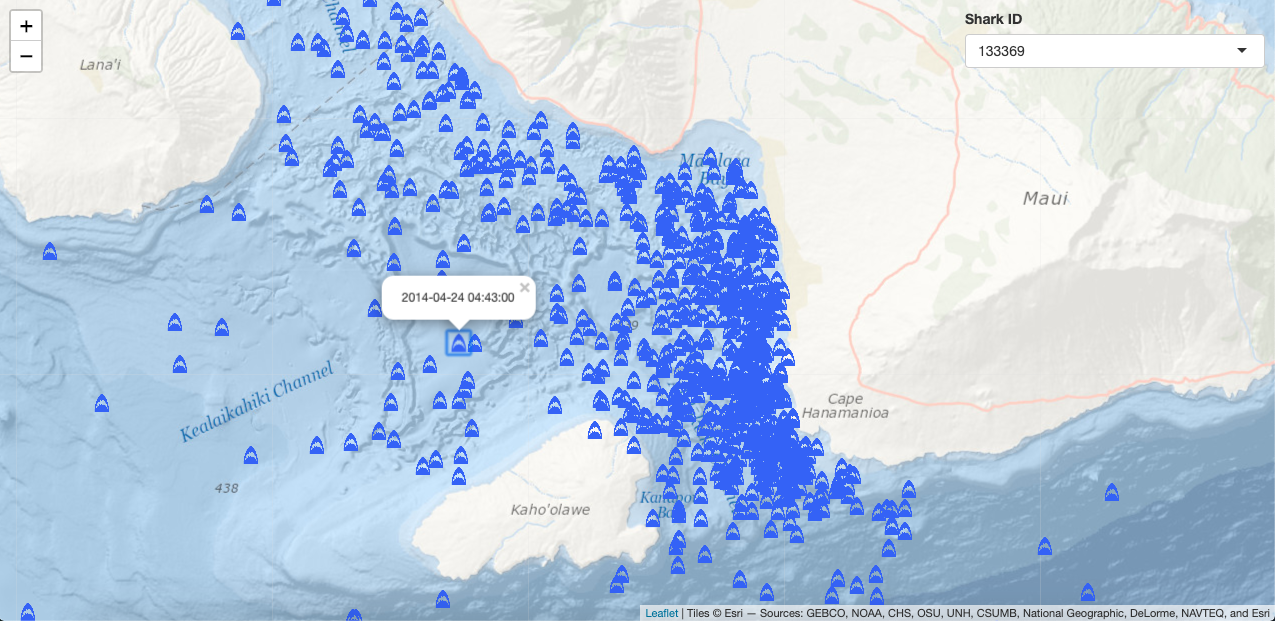
Collecting data like this matters a lot, actually. Sharks need to be protected from humans, and on some level, humans need to be ‘protected’ from sharks. The former is a policy issue, while the latter is an education issue. Knowing where sharks go tells us which areas demand protection, in terms of restricting commercial and non-commercial fishing, and ensuring non-polluted waters so the entire ecosystem can thrive. This is especially important in areas where sexually mature sharks are present because it could mean protection for birthing sites. (All tiger sharks with sex/length information except one were categorized as sexually mature in the present analysis). Beaches that correspond to Tiger Shark hot-spots can be signposted with warnings of heavy shark presence; making it a well-informed ‘swim at your own risk’ situation. The data shows that Tiger Sharks are frequently present in the shallow coastal waters surrounding the Hawaiian Islands; some may find it remarkable, that all things considered, that there are so few incidents.
“In the Hawaiian Islands, since 1828, there have been 116 confirmed shark attacks and only 8 confirmed shark attack fatalities. For Hawaii, that averages out to a shark attack every 1.59 years, and a fatality approximately every 23 years” (Florida Museum of Natural History). Yet more proof that sharks do not predate on humans, and it’s unfair to label them as attackers. Ultimately they are insanely evolved and intelligent, and occasionally, investigate humans that look strikingly like seals at times.
As of August 2018, the IUCN lists the Tiger Shark as near-threatened, with a declining population. Guessing how many of anything exists in the world’s oceans is an impossible feat, but it is clear that sharks (in general) are being exploited at unsustainable levels - and for ludicrous things like shark fin soup and the oil from their livers, not to mention insurmountable death due to by-catch. Similarly, it’s difficult to know exactly how much damage we are doing, but most estimates say humans kill 100-150 million sharks each year. That’s direct damage - we mustn’t forget to factor in the impacts of human-induced climate change (we’ve made the oceans up to 30% more acidic)… Demolish the top of an ecosystem, and the implications are not small.
Read more here.