When the longevity of covid began to sink in, and I thought I was experiencing peak boredom in April 2020 (ha…ha…) I jumped at the chance to do something out of usual routine when Airbnb launched their ‘online experience’ branch (also, at the behest of covid). In a sea of intriguing opportunities, sharks arose (swam?) to the surface, in the form of ‘Meet a shark scientist!’ - basically my pipe dream now given my status as a career statistics student. Over the course of an hour, Justin Blake described his work, his unique way of procuring funding to run his non-profit for ocean conservation, and reaffirmed my belief that being a shark statistician would be the coolest way to mash up my background and my long-standing fascination.
Our paths ceased to run parallel after the hour was up, except for the small detail of me following Justin’s Instagram page so I could occasionally ogle at the cool underwater shots. Months later, I answered the public Instagram call of a certain marine scientist looking for a way to animate maps for shark tracks.
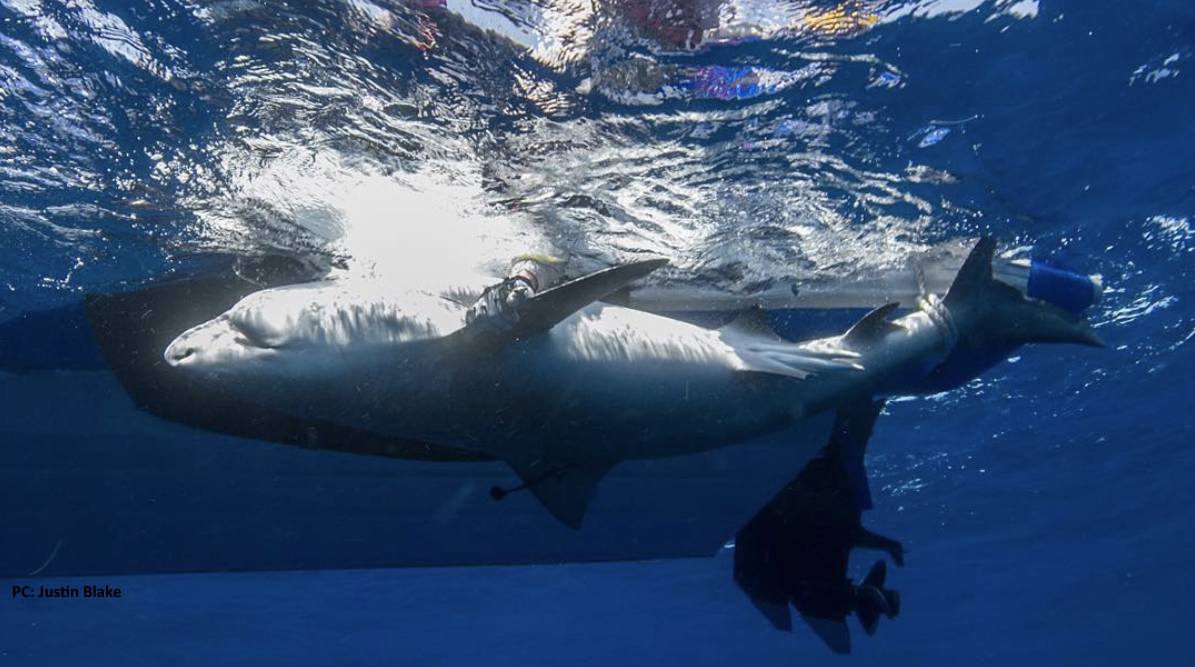
RockHopper is a Cape Town-based nature tourism non-profit, whose proceeds are used to run the research and conservation side of RockHopper. This includes tagging and track sharks off the coast of South Africa and Mozambique for study and conservation purposes. At the data level, this process (post-data collection) is highly visual and has become something of a viral sensation (e.g. OCEARCH tracker). My proposed solution was R Shiny + Leaflet, which was both promising, and challenging. R Shiny can be a powerhouse for some things, but animations and things that ‘play’ are not one of them.
For example, even with relatively small tracks that span only 1-2 years, the amount of data I was asking R to process and display in real time, at a pace that made it appear continuous, was cumulatively large. The tracks lagged and were frustratingly slow. The solution I gathered was to, for each added data point, clear the map (and ergo the data) and re-display the prior data-point’s track only once, rather than overlaying it continually each time a new data point is realized on the map. The effect then, was that the prior track would not re-stack on itself for each additional data-point in time. This proved efficient enough for the fast processing needed.
There we some serious curve balls I encountered that in the end, I had to simply realize the limitations of the platform and create the best workaround available. Attempting to include a button to export the longitudinal track as a video turned into a time-expensive task. The crux of it being the track one watches is not processed in the background as a ‘video’. It’s a series of ‘photos’ moving so quickly it appears as a video. I came close with asking R to export each image as a still, and string them back together in the form of a playable GIF, but that came with its own string of problems. Again, asking the machine to extremely quickly process images without interruption was unreasonable. Further, because R Shiny apps live on a cloud service, it was impossible to write general enough read-and-write permissions to let any user take advantage of that process. I went so far as to write a screen capture script in Python and call it from R (which, to my surprise, worked!), but sadly calling the Python script would cause the longitudinal track to pause, and thus defeating the purpose. My last high-effort undertaking was to implement some sort of Java script, but it was simply too far outside of my wheelhouse. In the end, rather than implementing something integral to the tool, the solution was to take advantage of external machine capabilities that are now ubiquitous. We all tend to be familiar with the ‘screen-capture’ concept for screen-grabs, but perhaps less commonly used is screen-recording with the same software. The web-app contains the details to do so in iOS and Windows. Is it a perfect solution? No, but it is a solution and there is still value in that.
After months of on and off work, the RockHopper Marine Tracker (also at the RockHopper website) was born, and born much larger than we had originally imagined! Enjoy tracking and understanding the sensational journeys of the sharks RockHopper has given us the privilege of experiencing. We hope to continue updating it with more data, tools, and information as it becomes available. It’s such a rarity to be privy to underwater life; data visualization and statistics are there help us make sense of it all.
Have feedback? Want to track your own animals for your organization? Drop me a line!
Want to buy me a coffee and support my work?